
Science animation that makes research understandable without making it wrong
You’ll talk to a learning designer about one concept and who needs to understand it.
We turn dense research, invisible mechanisms, and complex systems into visual explanations the right audiences can understand and act on, without losing the scientific integrity that makes them credible.






The research is right. The explanation starts where the expert is, not where the audience is
Scientists and technical experts communicate with precision, depth, and accuracy. The problem is rarely the quality of the knowledge. It’s the gap between how the knowledge was formed and what an audience needs to receive in order to understand it.
Researchers know their subject at the level where the interesting things happen: the mechanism, the system interaction, the causal chain. They know it so deeply they’ve lost sight of what a non-expert, a decision-maker, or a colleague from another field needs to understand first.
This is hardest when the process is invisible at normal scales: molecular interactions, geological timeframes, energy systems, biological mechanisms. Text can describe these accurately. It cannot make them visible.
The most common science communication failure isn’t inaccuracy. It’s explanations that are correct at the expert level and inaccessible at the level where decisions and understanding need to form.
What audiences are still unsure about after reading technical content
- What the concept looks like in operation, not just how it's defined
- Why it matters beyond the specialist context it came from
- How the components of a complex system interact
- What the research means for a decision, policy, or practice they own
What science communication has to do, and whether the paper, a conference talk, or a static figure delivers it
The goal isn’t simplification for its own sake. It’s making complex knowledge accessible at the right depth for the audience’s purpose, without stripping out the mechanism that makes it credible.
How science communication options compare: what each one is strong at, and when to choose it.
| F.Learning built up from the audience, protected through review | The paper or report | A conference talk and slides | A static figure or infographic | A press release or science journalist | |
|---|---|---|---|---|---|
| Makes the mechanism visible? | Strong: shows process, scale and interaction | Weak: described, rarely shown | Partly: depends on the speaker's slides | Partly: shows structure well, struggles with process over time | Weak: described by analogy |
| Holds accuracy at that depth? | Strong: threshold set with the researchers, then protected through review | Strong: complete and accurate by definition | Partly: accurate, often too dense | Partly: if the designer understood it | Weak: highest risk of distortion |
| Calibrated to a specific audience? | Strong: depth set by purpose | Weak: written for peers | Strong: pitched at the room | Weak: one level for everyone | Strong: widest reach to the public |
| Clarity survives expert review? | Strong: two passes: one for correctness, one for comprehension | Weak: not the goal | Weak: rarely reviewed at all | Partly: often loses clarity in review | Partly: reviewed for accuracy, not clarity |
| Cost and effort to produce? | Partly: higher, and needs your time | Strong: already written | Partly: slides take a day | Strong: cheap, and fits in the paper | Weak: highest, PR push can cost a lot |
| Best when | the knowledge has to cross into another field | your audience is other specialists | you are speaking to a room already interested | the structure matters more than the process | you want press coverage above all |
👈 Swipe horizontally to view full table 👉
In short: The paper stays the complete and accurate record. A static figure is cheap and sits inside it. A journalist reaches the public faster than anything we produce but cost the most. F.Learning is strongest where the mechanism has to be seen rather than described, and where the explanation has to stay clear through expert review, which takes researcher time and cost.
Input
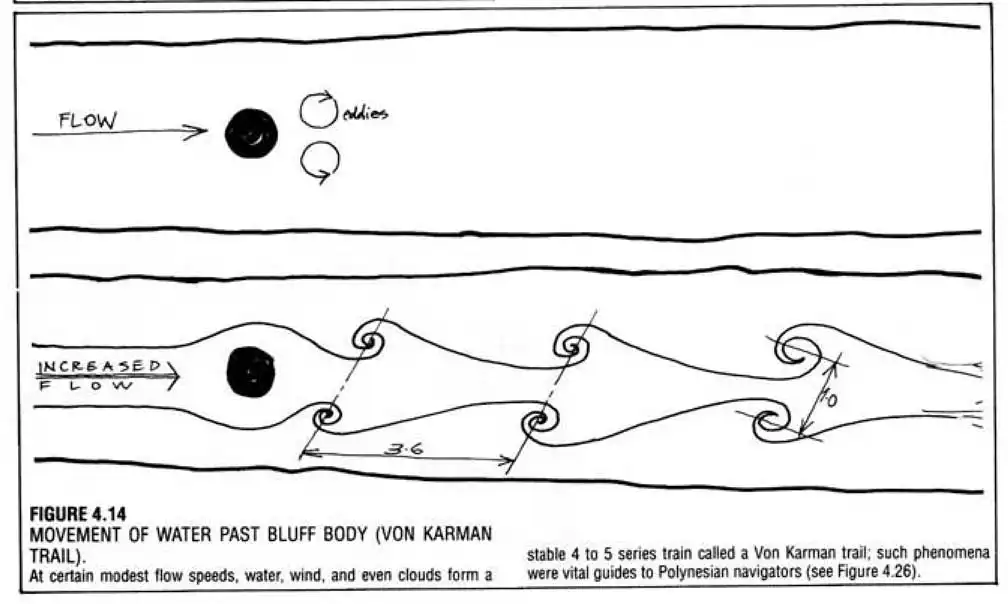
Output
The same mechanism, as a figure and as a process. The figure shows what’s there. The animation shows what happens.
Where this isn’t the right answer
If your audience is other specialists in your own field, the paper and a good figure are usually enough.
This work earns its cost when the knowledge has to cross a boundary: to another discipline, to decision-makers, to students, or to the public.
What F.Learning protects during expert review
Most science communication starts from full expert knowledge and strips it down. It starts too deep and loses people before they arrive. We build up from what the audience already knows, with just enough depth to make the concept meaningful.
The harder part comes later. It isn’t simplifying the explanation. It’s keeping it simple through review. Every expert reviewer, reasonably, adds a qualification. Each one is correct. Together they rebuild the density the project set out to remove.
So review runs as two separate passes with different questions. The subject expert checks that nothing is wrong. A separate comprehension check confirms the audience can still follow it. A change has to pass both.
Starting from the expert loses people before they arrive. Starting from the audience builds only as much depth as the concept needs.
Where we focus, after work across geology, energy systems, healthcare research, and pharma mechanisms
- Find the invisible mechanism: the part text and static diagrams leave abstract
- Get the simplification threshold right: accessible enough to land, not so simple that integrity breaks
- Show what 2D can't: Spatial, temporal, and scale relationships
- Calibrate to purpose: conference, course, policy briefing, or public
Where the explanation is losing the audience, and what to build for each case
Different complex-information problems need different approaches.
When the information is accurate but too dense to follow
Layered explanation structures (Content Structuring) | Visual summaries and reference guides (Documents & Graphic Design)
Best suited for research findings, technical documentation, scientific reports, and policy information.
When systems, processes, or relationships are hard to picture
Animated concept explanations (Explainer & Product Animation) | Visual models for invisible mechanisms (3D Animation)
Best suited for scientific processes, technical systems, and cause-and-effect relationships that text and static images can’t show.
When people need to explore the information and apply it to a decision
Interactive concept exploration | Guided data experiences (Interactive Learning Design)
Best suited for audiences who must compare options, interpret evidence, or understand trade-offs.
When one complex subject has to reach several audiences
Modular explanation systems (Content Structuring) | Reusable visual assets (Explainer & Product Animation) (Documents & Graphic Design)
Best suited for organizations speaking to experts and non-experts, across presentations, courses, documents, and digital platforms.
Selected example
The Hummingbird Effect: a green hydrogen keynote, built around one analogy
A hydrogen consultant preparing a career-capstone keynote needed his audience to understand the science behind green hydrogen. He already had the way in, an analogy he called the Hummingbird Effect. What he didn’t have was a way to show it.
We turned the analogy into an animated visual story for the keynote. He reviewed every mechanism in technical detail, because the point was never only to impress the room. It had to be right.
Scope
- 4 min 32 sec 3D animated visualization
- Developed for a scientific keynote presentation
Result
The animation was presented by Cortney Mittelsteadt, VP of Electrolyzers at Dioxycle, at The Electrochemical Society, giving the keynote a visual way to communicate the complex relationships behind green hydrogen. After seeing the final piece, Cortney described the work as “awesome” and said he was “super happy” with the result.
For an expert audience already familiar with the individual technologies, the visualization shifted the conversation from what each component does to how the system works together as a whole.


Geoff Lawton's Permaculture Design Course: ecological systems made visible
A world-renowned permaculture educator needed visual explanation of complex ecological relationships (energy flows, spatial systems, cause and effect) that live-action footage of a real farm could show but not explain. Learners saw the environment but missed the system behind it.
We produced 330 animated learning videos that added a visual explanation layer alongside Geoff’s teaching, making invisible ecological mechanisms visible next to the real-world footage.
Scale
- 330 animated learning videos
- Used across more than 1,000 course materials
Result
The course gained a consistent visual layer for explaining complex ecological systems alongside real-world demonstrations. Across hundreds of lessons, learners could move between seeing permaculture in practice and understanding the systems behind it.
Instead of seeing isolated elements of a farm, they could follow how water, energy, plants, animals, and landscape features connect and influence one another as part of a larger ecological system.
How F.Learning builds it: four steps, 6 to 10 weeks, with two review passes
Step 1
Identify what the audience actually needs to walk away understanding
Not full expert knowledge, but the minimum accurate understanding that supports a decision, a behaviour, or informed trust in the subject.
Step 2
Map where the concept breaks down for a non-expert
We find the specific point where jargon, scale, or abstraction loses the audience, instead of simplifying the whole explanation evenly, which usually makes every part slightly less accurate.
Step 3
Build the explanation upward from that point
The visual and narrative sequence builds understanding step by step, rather than compressing an expert explanation until it’s short enough.
Step 4
Validate accuracy without losing clarity
SME review confirms correctness; a separate comprehension check confirms the audience can still follow it.
Precision that quietly creeps back in during review is one of the most common ways clarity gets lost after the fact.
Related insight
More on leadership and manager capability:




Related services & solutions
Related Training Solutions
Related Services
Frequently asked questions
How do you maintain scientific accuracy while making content accessible?
When is 3D animation necessary versus 2D?
Is this only useful for public audiences, or also for specialists?
How do you handle research that is still being developed?
How long does a science communication project take?

Pick one concept that keeps getting lost between your team and its audience. We'll find the exact point where it breaks, before anyone talks about production.
30 minutes with a learning designer. No deck required.